What is Choking Delhi’s Air?

The title could have, as well been “What is choking the Indian Skies“. After all, the air in whole of India seems polluted.

To start with, we pulled up a real-time map of air pollution across the world. Here is the view we see on most of the days. It’s not just Delhi, it’s Kolkata, and Mumbai, and Lucknow, and Kanpur, and Varanasi, and Allahabad, and most of the major Indian cities. By many parameters, India has 14 of the Top 20 polluted cities in the world!

source: http://berkeleyearth.org/air-pollution-overview/

Few months back, we started on a “massive” journey to solve the most critical problems facing the Earth. Crisis situations like the one above is a sign of something gone terribly wrong in the way India is progressing. We knew things will not be intuitive, much less easy.
One of the problems we looked at recently, was that of pollution in Delhi’s air. One widely used index to measure air pollution is called the AQI (Air Quality Index). AQI normally has 6 grades, with values ranging from 0 to 300. Anything above 300, is Hazardous.

source: http://aqicn.org/scale/

For example, here is the AQI levels in Tokyo, Japan.

As you can see, most of it is green with AQI of less than 50. And almost all within 70.
And here is Delhi.

Apart from the glaring difference in AQI level, there is also a huge difference in number of air quality stations in Tokyo vs those in Delhi. One would think that, extreme levels of pollution ought to have sprung Delhi into action, but we don’t seem to care. The popular adage ‘You can’t solve what you don’t measure’, seems relevant here.

The most troubling thing about Delhi’s Air is not that it is so highly polluted, but that we are oblivious to it. While in many countries, alarms go ringing across the establishment at AQI in USG range (101 – 150), we hardly seem to care even in Hazardous zone (300+).

Most digital displays for AQI have only 3 digits since anything above 300 is Hazardous. Delhi is one of the few cities and perhaps the only national capital in the world to have maxed out the AQI displays as well.


So, what is choking Delhi’s Air? And why we don’t seem to care even at AQI levels that would be terrifying for most Govts and Policy Makers across the world? Why is that California, even after massive forest fires still is at AQI levels that is 2 grades less than us? And how can we solve it?

While there is visibility on the sources, like Paddy Burning, Dust, Vehicular Pollution, Power Generation etc, we found there is very little clarity on the quantum of each source. This is hardly surprising given the low number of air pollution monitoring stations Delhi has. Different sources, experts and institutions have widely different numbers – sometimes varying by as much as 200%. While we see lot of noise about Paddy Burning, we hardly see any noise about the others. Why is that so?

What are the alternatives farmers have? Why is paddy being burned at all? And is Paddy really as big a source?


The Prime Suspect – Paddy Burning

When we look at paddy burning, we ask a simple question why and when did it start? Why is it prevalent in North India, mainly Punjab and Haryana, but not in other states? Studies gives us two important pointers.

Level of Farm Mechanization: We looked at the level of farm mechanization in India.

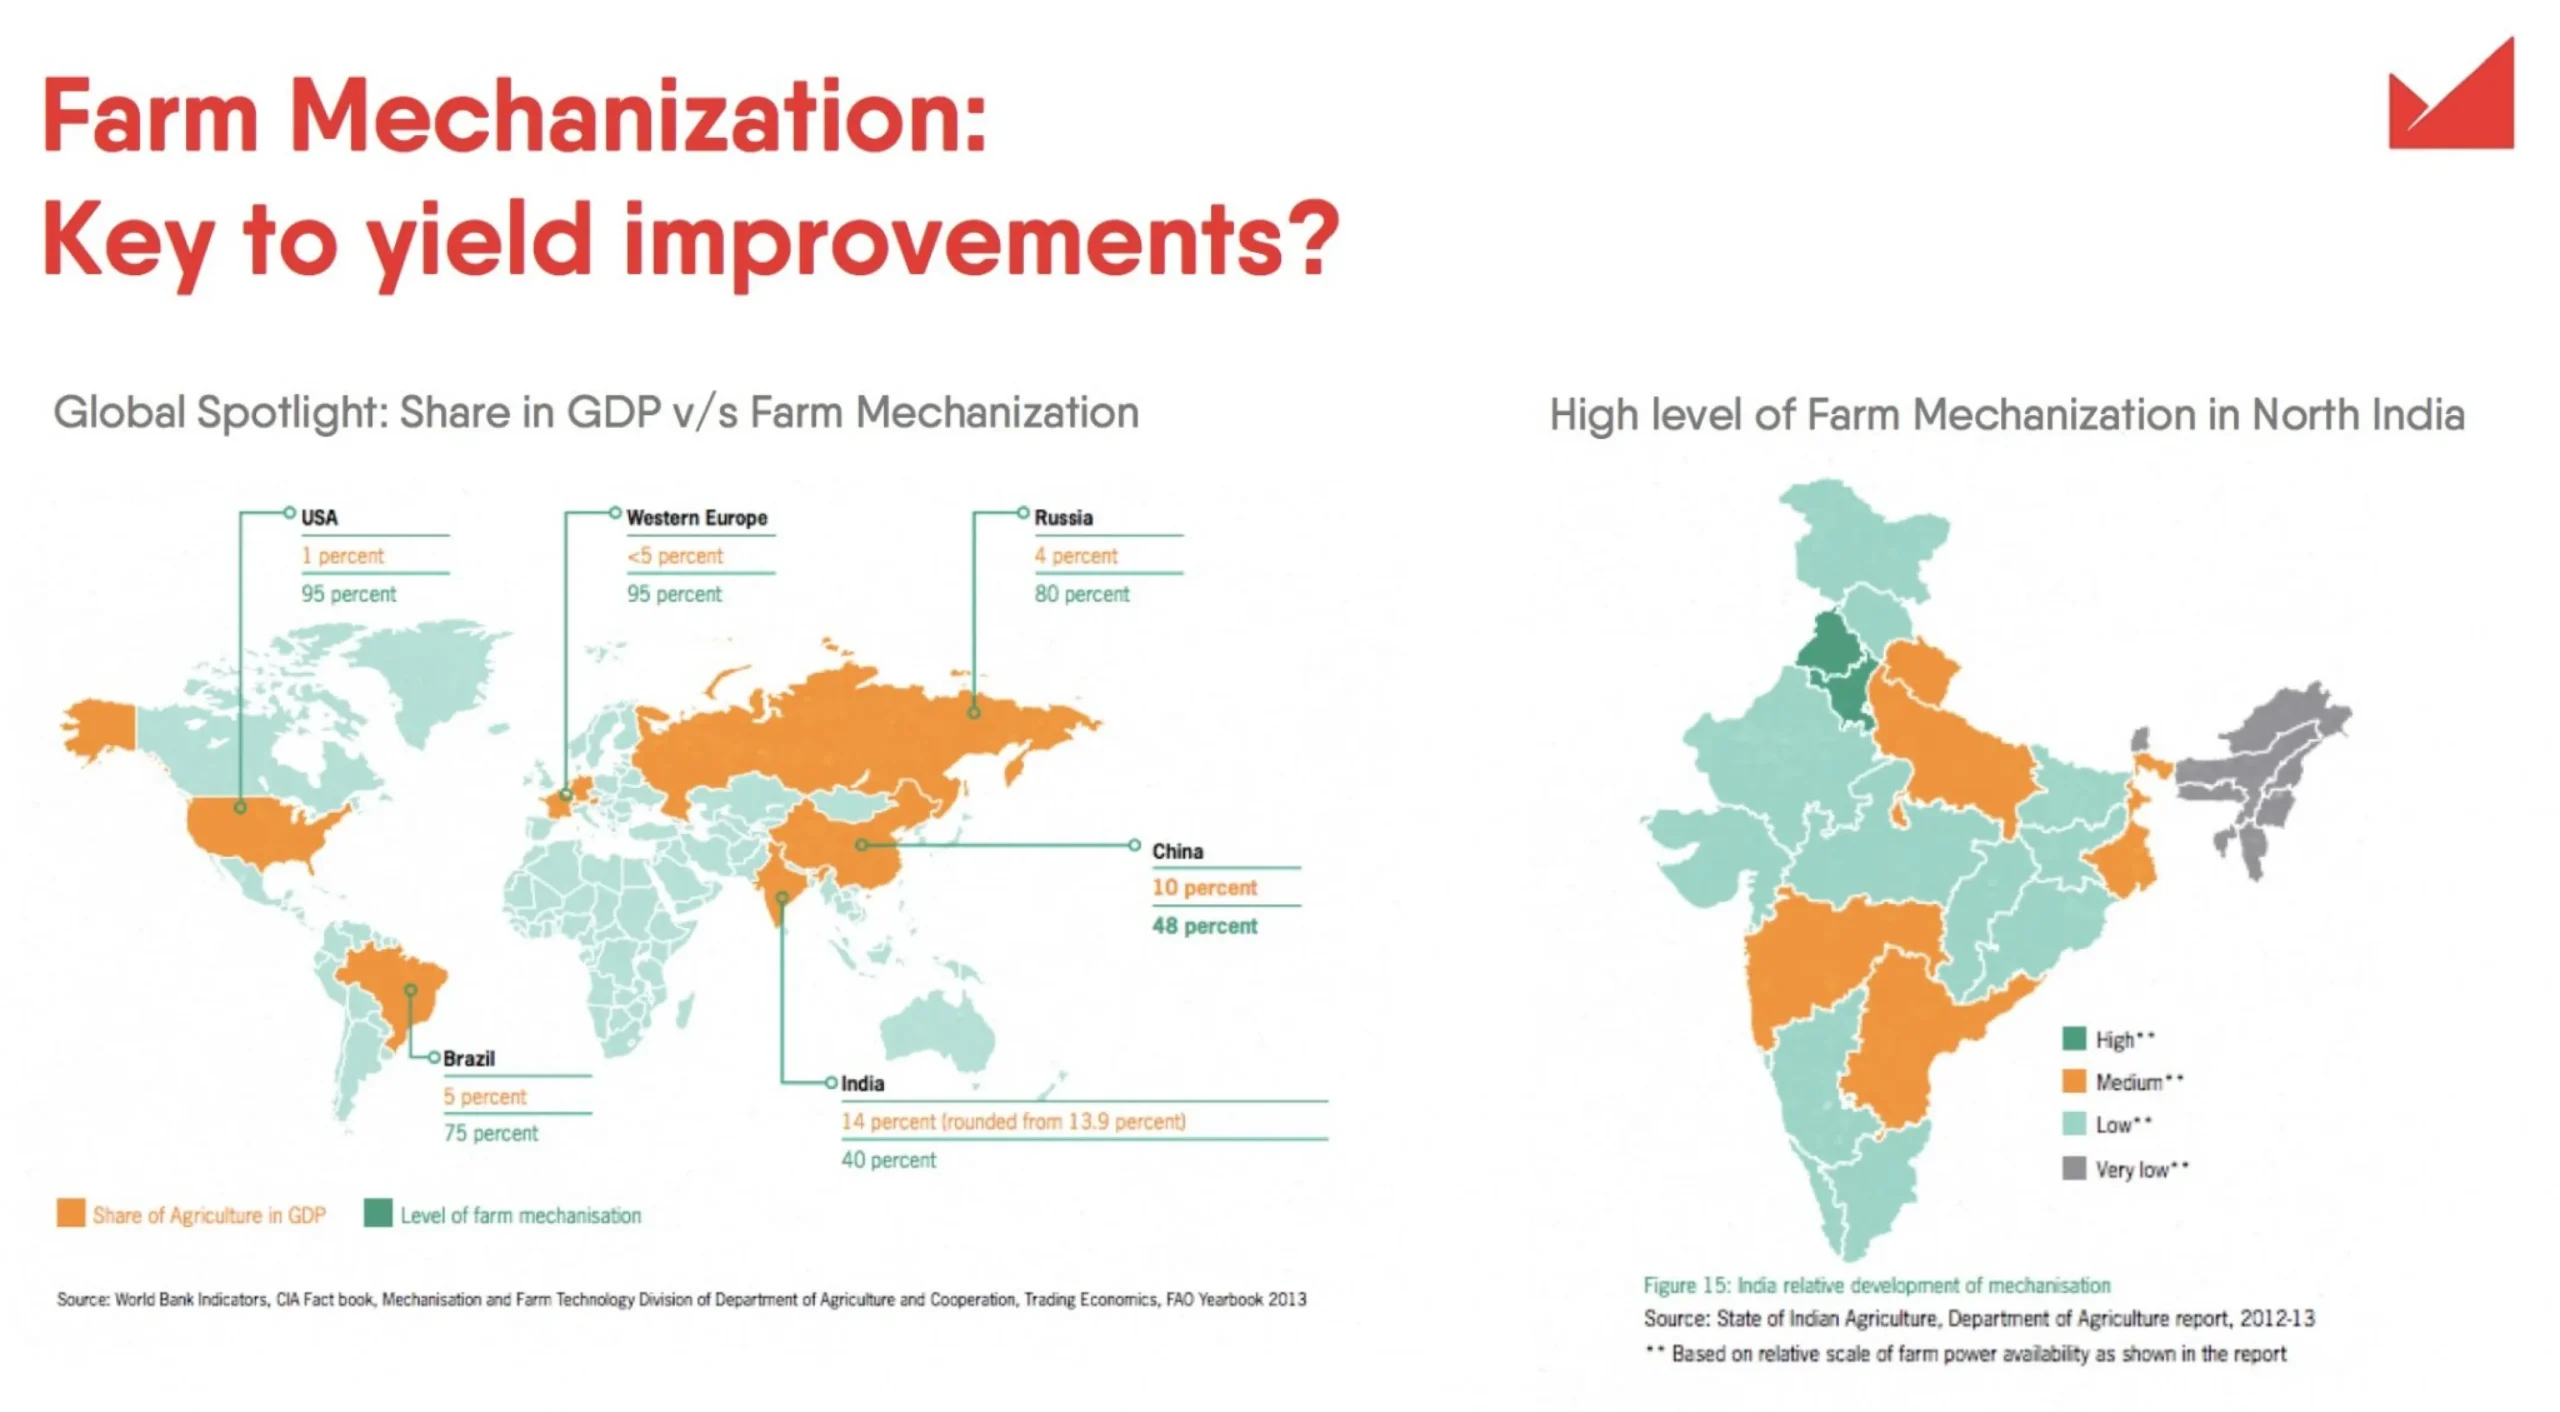
Punjab and Haryana have the highest level of farm mechanization among all Indian state. Combine Harvester sales have grown exponentially from 2500 units in 2009, to 12380 in 2010 and 54,230 in 2011.

So how does it affect us? Paddy, when harvested by hand, is cut close to the ground. However, decreasing labour supply, increasing wages and factors like subsidies have led to higher harvester sales. Combine harvesters, while faster than human labour, leave more crop residue. There are better machines but their usage is low.

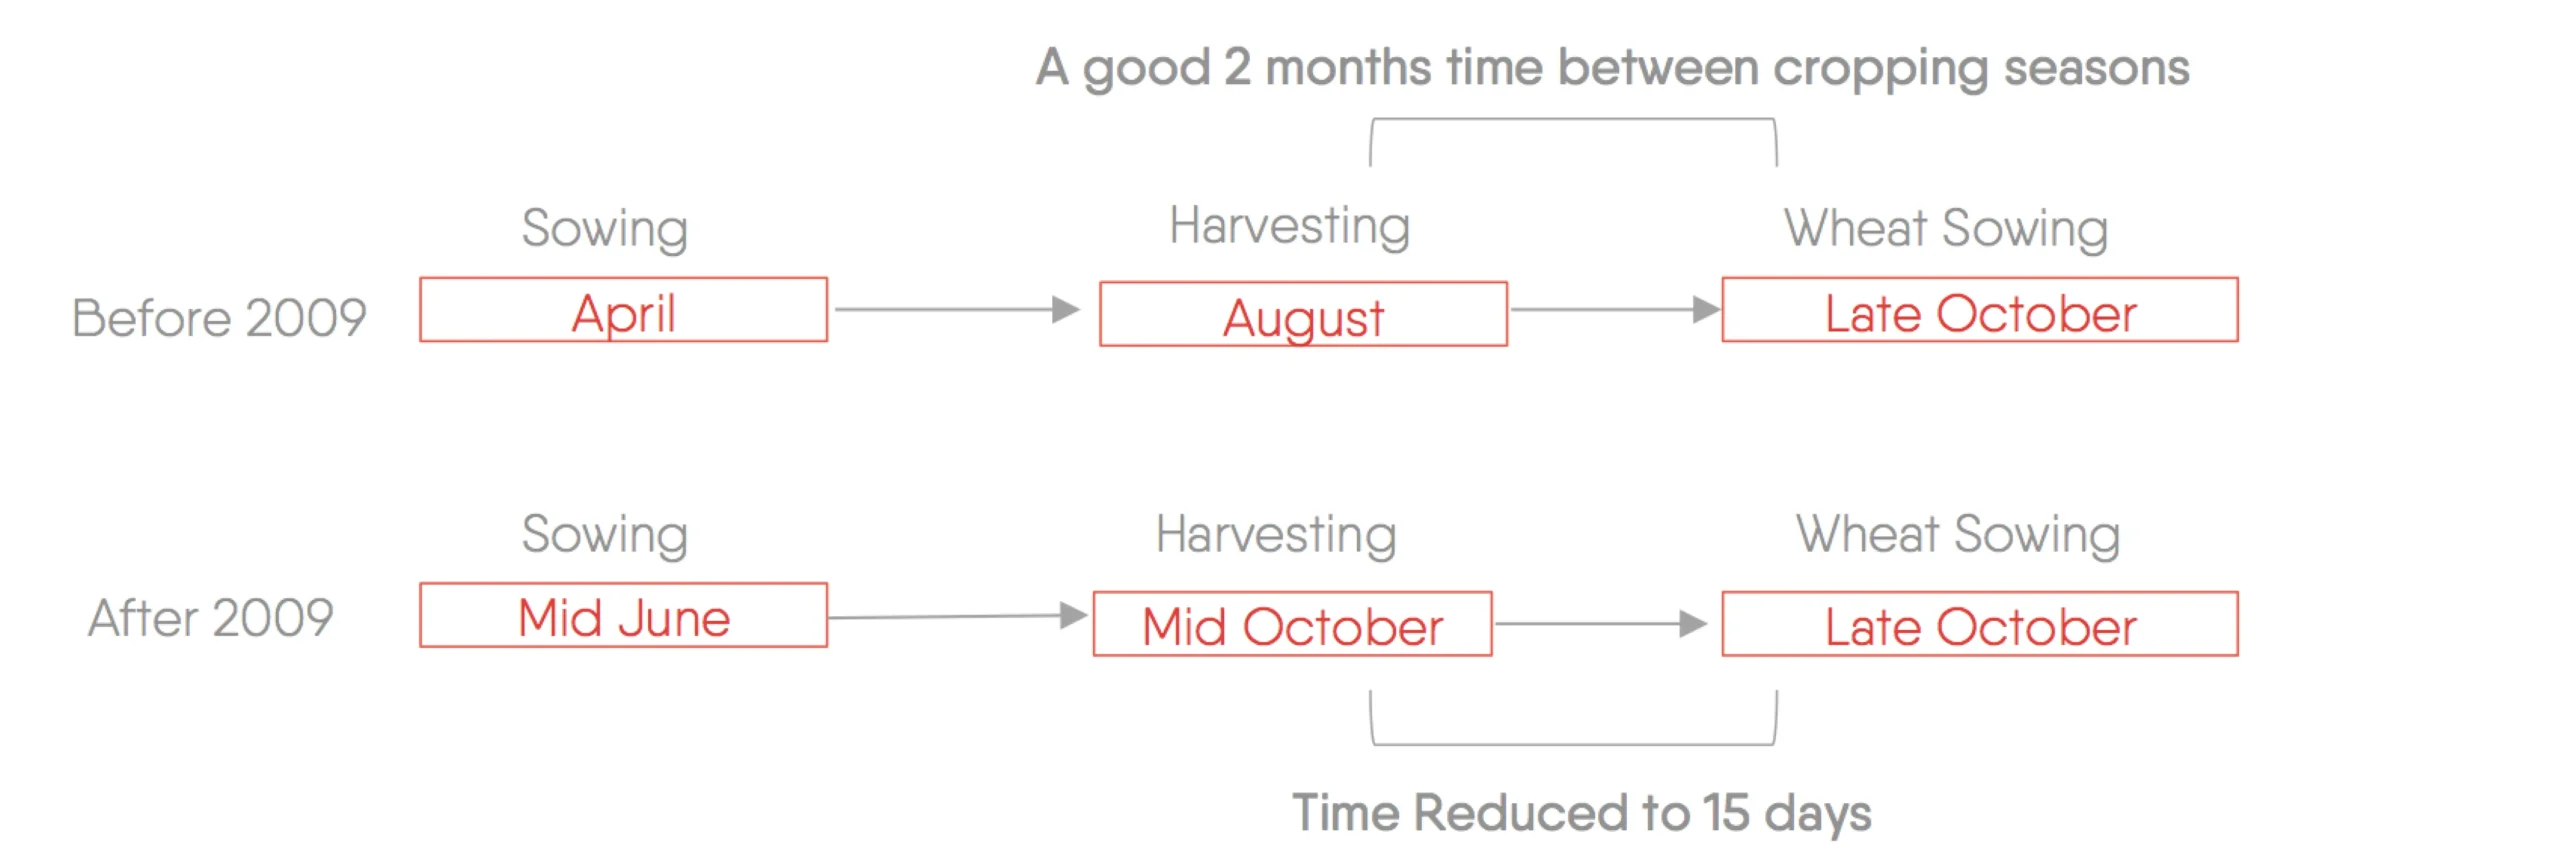
An unintentional affect of a Government Policy: Paddy has a cultivation period of 120 days between sowing and harvesting. Before 2009, the farmers used to sow Paddy in April, and harvest in August. The next crop cycle is of Wheat. Sowing of Wheat starts towards end of October. Any delays into November has a steep negative impact on the yield. Till 2009, farmers had a good 2 months time (August to October) between the two cropping seasons. So what changed?

Punjab Preservation of Subsoil Water Act was passed in 2009. According to this Act, farmers can no longer sow rice in April, but have to wait until the middle of June (the notified dates) to do so. Haryana too has followed Punjab, and passed a similar law. So the paddy sowing and harvesting cycle has been artificially shifted by about 2 months. Since 2009, farmers have only 15 days to ready their land for wheat sowing.

Higher Crop residue due to mechanization, and Government policy to allow sowing of rice only after middle of June, together have become a lethal combination for Delhi’s air. With just 15 days to prepare their farms, the farmers are forced to burn the crop residue.

Wind: We also looked at the wind rose diagrams in Delhi. Here is July – August.

And here is October and November.

It is evident from the wind patterns in October and November that pollution caused by Paddy burning flows towards Delhi.

So what is the solution?

Solution: Policy + Innovation

Policy

1. The Punjab Subsoil Water Preservation Act should be modified suitably, to stop putting unnecessary burden on farmers to ready their fields in unrealistic timeframe.
2. Millets made up 40% of all cultivated grains before the Green Revolution. They can be a substitute for paddy. Millets are rich in nutrients and resistant to drought, thus ideal for small farmers.

Innovation

1. Using Paddy Straw to manufacture bio-degradable pulp that has a wide applications, especially in tableware and fabric. Currently, the pulp in India is largely made from sugarcane in Uttar Pradesh and Maharashtra. The chemical process of converting Paddy Straw to pulp has a few challenges because of the high silica content in paddy straw. However, there are some innovative startups that have been successful in manufacturing pulp from paddy straw at a lab-scale level, and are already building mass-scale reactors. Bio-degradable pulp-based tableware would also reduce the epidemic of non-biodegradable plastic cups and plates.
2. Paddy Straw can also be used as a feed to Bio-CNG plants to produce CNG. The by-product of this would be fertilizers. Paddy Straw can also be used as a feed to Ethanol plants.


Is Paddy the only reason?

Given the magnitude of news bytes and TV airwaves it gets, one would tend to think that Paddy is the main reason for air pollution in Delhi. But is Paddy the only reason?

Paddy burning takes place in the month of October. Now looking at some images of Delhi we find that the AQI is 400+ even in December.

Even 6 months later, in February or June, Delhi remains in Unhealthy grade.

So, what are we missing?

Data shows that the base levels of pollution in Delhi has risen and remains in Unhealthy grade consistently throughout the year. The downside of blaming Paddy is that it makes us oblivious to other sources of pollution; sources that are way larger contributor to pollution than Paddy, are ever-existent and growing every day.

Paddy burning aided by Wind patterns adds to this base level during the month of October-November. Unless effective measures are taken on an urgent basis, this base will continue to rise and affect the population. What causes this base level to be so high? Why do we have AQI in 200+ range when Tokyo with a population density of 1.5 times of Delhi has AQI of 70?

It is time to call out the elephant in the room.

The Elephant in the Room – Vehicular Emissions

The number of registered vehicles in Delhi crossed the 10 Million mark in May 2017. The latest estimates for 2018 stand at 11 Million, indicating almost 10% rise year-on-year. The biggest chunk of these, 66% are two-wheeler – motorcycles and scooters that are known as major air polluters due to poor emission standards. Also, more than 3.6 Million vehicles are more than 10-years old, with older emission norms and pollution controls.

A study conducted in IIT Chennai on vehicular pollution measured the PM across different seasons, days, and hours. It was observed that PM2.5, PM1, and PM10 had a considerable increase during the rush hours of morning and evening. There is a high correlation between vehicular traffic and PM levels in all seasons.

At 1749 Km of road length per square km, Delhi has one of the highest road densities in India. Delhi’s road network of 33,000 Km is almost 10 times that of Chennai. And with more than 11 Million vehicles, 66% of which are 2-wheelers, it is imperative that the Vehicular Emissions are increasing at an ever growing rate.

Unless the vehicular emission of Delhi is solved, the base AQI levels will continue to rise, making the situation worse day-by-day.


Solution: Policy + Innovation

Policy

Better Design with Integrated Transport: Delhi Metro is a great step towards transporting people, faster, safer and without pollution. Its ridership of 1 Billion annual riders is just a proof of the huge latent demand for a good public transport in India. Metros can’t go everywhere, and constructing new metro lines is time and resource intensive, and costs millions of dollars. While Delhi Metro keeps expanding, there is an urgent need for a large and efficient multi-modal integrated transport network. Such a network would have mass transport vehicles like bus along with last-mile mobility solutions like e-Rickshaw, electric taxis and electric 2-wheeler.

picture credit: City of Munster, Germany

It is estimated that Delhi needs 11,000 buses to meets the travel needs of its people, but the city is awfully short with just about 5,000 buses, out of which only 1600 are integrated multi-modal. An alarming 99% of its fleet is set to retire in 2025. This is a great time for Governments to look to introduce zero-pollution all-electric fleet of buses.

There is an urgent need for Governments to encourage startups in clean mobility, like e-Rickshaws, e-Scooters and e-Bike, parking for electric vehicles and charging infrastructure and to do away with unnecessary red-tape and licensing in the transport sector.

Need of the hour is to design fully integrated transport rather than stop-gap arrangements that target only parts of the overall problem.

The Schrodinger’s Cat

There is a Schrodinger’s Cat in Delhi’s Air. Visible, yet hidden, it is the largest contributor to PM10. Like the Schrodinger’s Cat, unless you measure it, you won’t know it.
Welcome to Dust.
The footprint of dust in India, by default, is large. It is all around us in plain sight, yet it is least discussed about when solving pollution. It is visible, yet hidden.
  
It can be seen that India has both Natural as well as other types of dust, i.e, Anthropogenic Fugitive, Combustion and Industrial dust.

Eliminating dust is one of the lowest hanging fruit and one that can have a significant impact on pollution. Dust is a major component of air pollution, studies done in various Indian cities have estimated that Dust contributes anywhere from 50% to upto 87% of PM10. It is estimated that 131 Tons of dust is generated in Delhi, daily.

Interestingly while Dust has such a large footprint, and is the major contributor to PM10, most of the solutions to tackle dust are known and have been implemented successfully in many cities across the world.

Solution: Policy + Engagement

Policy:

1. Formalize and Enforce guidelines on the handling of dust and construction material.
2. Scaffolding sheet coverage of under-construction building to be mandatory.
3. Construction sites beyond a minimum size to have a real-time air quality monitor.

Public-Private-Partnership Engagement:

1. Plantation of shrubs alongside the roads to curb roadside dust.
2. Plantation of border forests around Delhi to capture the flow of dust from neighboring states.
3. Regulation of polluting activities like Tile and Rock cutting, Tyre burning in and around the region.


A note on Data (or lack thereof)

At the onset of this study, we started with data. And therein we faced our first major challenge. There is very little data on almost every factor that contributes to Air Pollution. While there is a lot of noise on Air Pollution itself, what is worrying is that no one seems to question the lack of data.

For ex:
1. Look at the first image of Tokyo. Why is it that Tokyo has so many Air Monitoring Devices, whereas Delhi with a larger population, and a larger geographical expanse has so few? Delhi needs a minimum of 77 monitoring stations, whereas there were only 35 as of Sept 2017.
2. On a national level, out of 4000 cities in India, only 300 (7.5%) are covered by manual air quality monitoring network. And there are only 55 continuous air quality monitoring stations in the whole of country. The devices have low r-square compared to higher-quality devices.
3. While Open Data Government Platform is a good initiative, there is need for States to contribute meaningfully to it in a timely and consistent manner. Try finding a simple dataset: district-wise number of registered vehicles in India (or any State) for 2017.


What now? Where do we go from here?

There is no doubt that Air Pollution in India has reached critical levels.

With a population of 16.8 Million, the NCT of Delhi has the 4th highest metropolitan population in the world, making India’s air pollution one of biggest tragedies of mankind in modern times, and no less than a weapon of slow mass destruction.

Solutions are in plain sight – electric vehicles, integrated public transport, stricter implementation of pollution control norms – are all known, and can be done. Solutions like these will not only reduce Air Pollution drastically, but will also positively impact India’s import bill on Oil and wasted man-hours in stuck traffic jams eventually leading to a positive impact on India’s GDP.

So, why is it not being done?

The most troubling thing about Delhi’s Air is not that it is so highly polluted, but that we seem oblivious to it. While in many countries, alarms go ringing across the establishment at AQI in USG range (101 – 150), we hardly seem to care even in Hazardous zone (300+).

Pollution is a multi-dimensional complex problem that requires different stakeholders and different Central and State Government bodies to work together – Transport, Agriculture, City Corporations, Pollution Control Boards, and Enforcement Agencies. It has not been solved, because no-one is responsible for solving it. No-body looses their job for a work not done.

For centuries, and across generations, Scientists and Innovators, backed by Capital and Entrepreneurs have helped mankind solve some of most critical challenges of their times. We believe it won’t be any different this time as well.


How can you help?

Solving a problem requires two things.

1. Awareness that a problem exists, and

2. Knowledge of the root causes of the problem.

We believe that creating an awareness about pollution and its root causes is important. If the primary sources of year-long pollution remain unsolved, we have the risk of only targeting the sources that are temporary in nature like Paddy (only 15 days a year), and our cities will still be having  higher levels of pollution throughout the rest of the year. So, how can you help? For the start, one small but impactful action you can take is to Share this Insight with your network using one of the icons alongside. The more people are aware about the real causes of pollution and their nature and magnitude, the better chances of right actions being taken. So, go ahead and share.

MEF Research

At Massive Earth Foundation, we engage with experts, scientists, startups and policy makers, and implementation agencies on issues that are plaguing the country in areas of Energy, Mobility, Agriculture, Sustainability, Built Environment and Air, Water, Waste. We invite you to join us for your opinions and insights on our upcoming research into the said areas. For early access to Research Reports, and to take part in our Research, please join the Knowledge Circle.